Author : Creative Collusions
Preview Of The Future Creation :
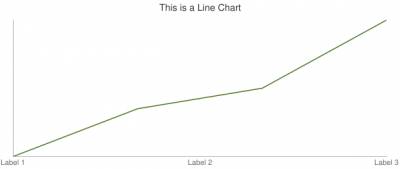

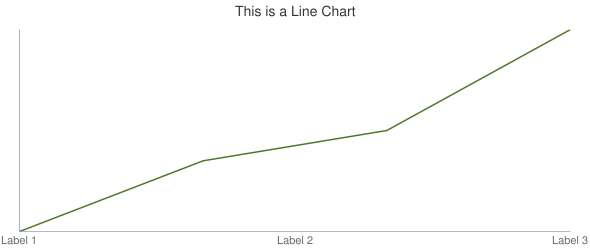
Line Graph
Now lets get started. As I already said, you only need the HTML scripts provided below to create the graphs, although the CSS script provided will create a professional shadow around the graphs.
We'll start of with the Line Graph. All you have to do is insert the following script where you want to display the graph:
Code
<img src="http://chart.apis.google.com/chart?cht=lc&chtt=This is a Line Chart&chl=Label 1|Label 2|Label 3&chco=4f762a,4f762a,4f762a,4f762a,4f762a&chs=590x250&chd=t:0,35,50,100&chf=bg,s," alt="Line Chart" class="frame" />
How to edit the Line Graph:
Use the colour highlights to navigate to what you can edit:
Quote
src="http://chart.apis.google.com/chart?cht=lc&chtt=This is a Line Chart&chl=Label 1|Label 2|Label 3&chco=4f762a,4f762a,4f762a,4f762a,4f762a&chs=590x250&chd=t:0,35,50,100&chf=bg,s," alt="Line Chart" class="frame" /
Grey - This is the title displayed above the graph.
Purple - This is the labels below the line graph (this is what the user looks at first).
Orange - This is the colour for each label.
Red- This is the size of the graph in pixels (px).
Blue - This is the volume of a label in a percentage (minimum is 1 and maximum is 100).
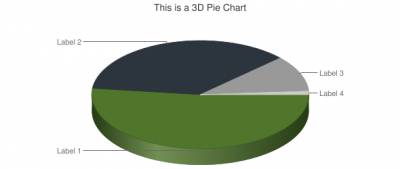
Green - Include this if you want the shadow around the image. 3D and 2D Pie Charts
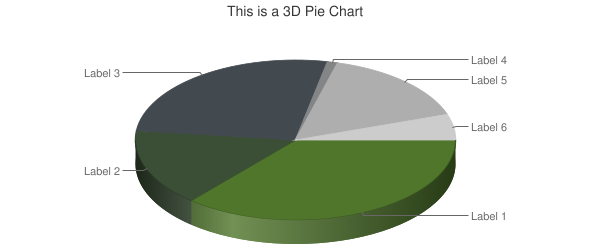
Next is the 3D and the 2D Pie Charts. I will show this one together because they are very similar.
For the 3D Pie Chart, use the script below:
Code
<img src="http://chart.apis.google.com/chart?cht=p3&chtt=This is a 3D Pie Chart&chl=Label 1|Label 2|Label 3|Label 4|Label 5&chco=4f762a,2c353d,999999,cccccc&chs=590x250&chd=t:50,35,10.4,1&chf=bg,s," alt="3D Pie Chart" class="frame"/>
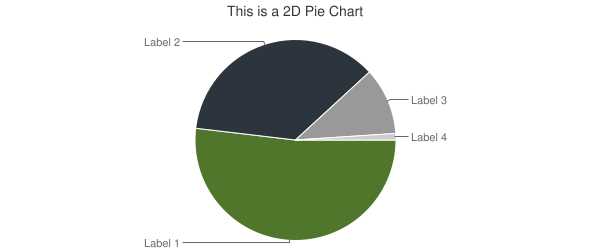
For the 2D Pie chart, use the script below:
Code
<img src="http://chart.apis.google.com/chart?cht=p&chtt=This is a 2D Pie Chart&chl=Label 1|Label 2|Label 3|Label 4|Label 5&chco=4f762a,2c353d,999999,cccccc&chs=590x250&chd=t:50,35,10.4,1&chf=bg,s," alt="2D Pie Chart" class="frame"/>
How to edit both charts:
Use the colour highlights to navigate to what you can edit:
Quote
src="http://chart.apis.google.com/chart?cht=p3&chtt=This is a 3D Pie Chart&chl=Label 1|Label 2|Label 3|Label 4|Label 5&chco=4f762a,2c353d,999999,cccccc&chs=590x250&chd=t:50,35,10.4,1&chf=bg,s," alt="3D Pie Chart" class="frame"/
Quote
src="http://chart.apis.google.com/chart?cht=p&chtt=This is a 2D Pie Chart&chl=Label 1|Label 2|Label 3|Label 4|Label 5&chco=4f762a,2c353d,999999,cccccc&chs=590x250&chd=t:50,35,10.4,1&chf=bg,s," alt="2D Pie Chart" class="frame"/
Grey - This is the title displayed above the chart.
Purple - This is the labels for each sector of the chart (this is what the user looks at first).
Orange - This is the colour for each label.
Red - This is the size of the graph in pixels (px).
Blue - This is the volume of a label in a percentage (minimum is 1. Note that all the number MUST add up to 100 in total).
Green - Include this if you want the shadow around the image.
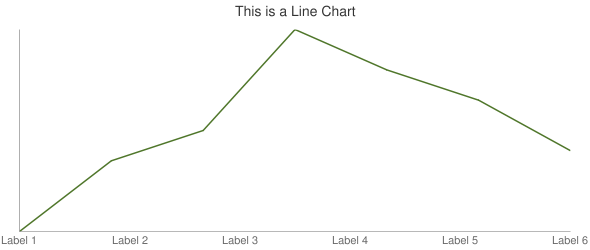
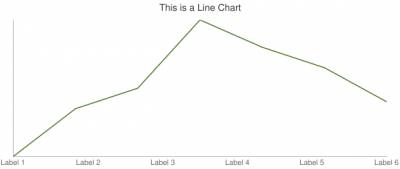
Adding New Labels
To add new labels to each graph or chart, all you have to do is add another number to the 'Labels' (marked Purple) and another to the 'Volume' (marked Blue).
For example to add new labels and volumes to the line graph:
Quote
src="http://chart.apis.google.com/chart?cht=lc&chtt=This is a Line Chart&chl=Label 1|Label 2|Label 3|Label 4|Label 5|Label 6&chco=4f762a,4f762a,4f762a,4f762a,4f762a&chs=590x250&chd=t:0,35,50,100,80,65,40&chf=bg,s," alt="Line Chart" class="frame" /
Marked Blue - Additional Labels displayed at the bottom.
Marked Green - New volumes for the new Labels.
Created :
Note that adding new labels to the Line Graph is almost the exact same as adding new labels to the Pie Charts.
Below is an example of a 3D Pie Chart with additional labels:


")